This document presents an analysis of the daily chart for Gold/U.S. Dollar (XAU/USD).
The chart illustrates a traditional ascending triangle pattern, which is generally regarded as a bullish continuation formation. This indicates that following a phase of consolidation, the price is expected to break out upwards.
Key Observations
1.) Ascending Triangle: The price is consolidating within a horizontal resistance level and an ascending support trendline. This results in a series of “higher lows,” signifying increasing buying pressure.
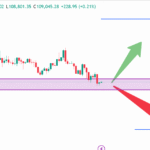
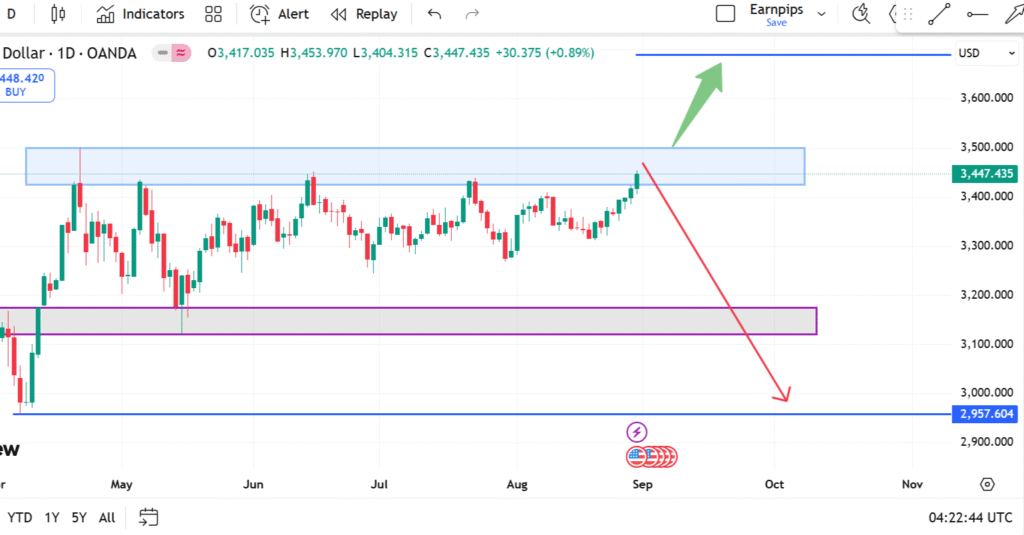
2.) Horizontal Resistance: A robust resistance zone is identified between approximately $3,434.24 and $3,449.37. The chart indicates that the price has tested and rejected this level on four occasions, affirming it as a significant barrier.
3.) Rising Support: An upward-sloping trendline serves as support. The price has rebounded off this line three times, demonstrating that buyers are consistently entering the market at higher price points.
4.) Price Action: The price is currently re-testing the upper resistance line. A decisive breakout above this level would validate the bullish pattern.
Potential Scenarios.
5.) Bullish Breakout (Most Likely Scenario): The ascending triangle pattern indicates a high likelihood of an upward breakout. Should the price close decisively above the resistance zone (~$3,450), the next major target would likely be the All-Time High (ATH) recorded at $3,499.23. The dashed lines on your chart depict this potential trajectory: a minor pullback, a final bounce off the support line, followed by a strong surge through resistance.
6.) Bearish Breakdown (Less Likely Scenario): If the price fails to breach the resistance and instead falls below the rising support trendline, the bullish pattern would be negated. This could result in a significant downward movement.
In conclusion, the technical configuration on this chart is bullish, with the price coiling for a potential upward movement. The critical event to monitor is a confirmed breakout above the horizontal resistance.